Components of an Excel Spreadsheet
Are you looking to build your knowledge in Microsoft Excel? Easy. All you need to do is request pricing!
Microsoft Office has several programs that you can learn to master. And one of them is Excel, which is used to create customized spreadsheets to hold many forms of data.
There are many reasons to complete onsite instructor-led Microsoft Office courses with Training Performance.
After attending just a few courses you will develop a deep understanding of MS Excel that can ultimately increase your performance drastically. And while you may complete some of the work on your own, a teacher is present to answer all your questions. Soon, with our MS Excel onsite training, you will have all the skills you desire!
A brief intro into the various components of an Excel spreadsheet
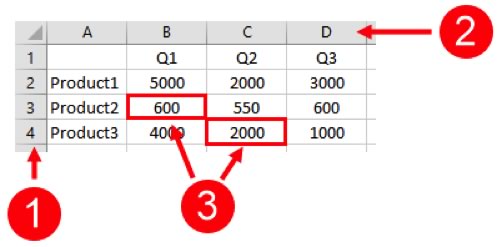
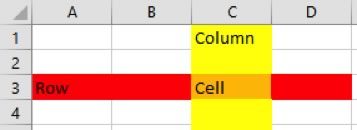
Microsoft Office Excel 2016 is the 16th version of Microsoft’s spreadsheet program. A spreadsheet is essentially a large flexible grid that is used to hold information, usually numerical data. In Excel, spreadsheet data is stored in a worksheet, which is made up of rows (1) and columns (2). The intersection of a row and column is called a cell (3):
Using Excel, you can analyze large amounts of data, move sets of data around to get a different picture of your figures, and generate a number of different charts and diagrams to help summarize the data.
What are Spreadsheets, Worksheets, and Workbooks
Spreadsheets are paper or digital documents that are typically used to store, sort, and work with data. They consist of intersecting rows and columns that form cells. These cells are used to enter, store, and display data. This data, while most often numerical, can include text, shapes, and pictures. Worksheets are a digital form of the spreadsheet that is used by Microsoft Excel. Notably this type of spreadsheet displays columns with alphabetical headers and rows with numerical ones.
A workbook is a collection of one or more worksheets. By default, new blank workbooks only include one worksheet, but you can add others if needed:
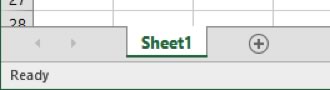
If the workbook that you are using includes more than one worksheet, you can switch between them by clicking the worksheet tab you want to view. The name of the worksheet that you are presently working with will be in bold type on a white background. In the previous image, Sheet1 is the worksheet that is currently being used.
What are Columns, Rows, Cells, and Ranges
Columns, rows, and cells make up the fundamental components of a worksheet. A column is a vertical series of adjacent cells from top to bottom. A row is a horizontal series of cells from left to right. A cell describes the intersection of a row and column:
Each column has an index letter. Since there are only 26 letters, and far more than 26 columns on a spreadsheet, the columns after column Z are indexed by the letters AA, AB, AC, and so on until the last column (up to XFD, over 16,000).
Each row has an index number. The rows are numbered from 1 through 1048576. The top left cell in the worksheet is indexed by the letter-number combination A1.
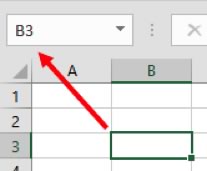
The active cell is the name given to the cell that is currently selected. The active cell is referenced in the Name Box:
Excel is designed to have data organized down the sheet under column headings more so than across the sheet in rows. This is why there are over a million rows down and only about 16000 columns across.
A cell range (or simply “range”) is defined as a series or block of adjacent cells. A range can be a very useful tool because it allows you to make changes (such as applying formatting) to multiple cells at once.